LLDB
Inspecting using frame variable or po
LLDB provides several commands to inspect variables during a debug session. Two most common of these commands are frame variable and po
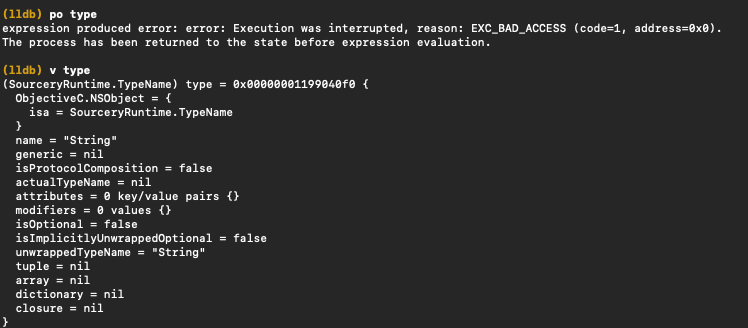
po vs v
frame variable
The frame variable command (or v for short) in LLDB is used to display variables in the current stack frame. The v command is LLDB’s own implementation for viewing data. It prints variables in a format that’s easier to read by humans. This command gives you access to variables that are in the current scope.
frame variable is explicitly a debugger side operation, which means it can work in situations where po won’t
po / p
po is roughly equivalent to expr -- [x description], and needs to be able to evaluate that in the attached process’s context, which requires accurate debug info about the process’s current state to pull off successfully. This requirement is also what leads to po being a lot slower in many situations (even if it works).
Symbolic breakpoints
This is quite fundamental, but it’s worth mentioning that you can set breakpoints not only at specific lines of code but also on exceptions, method calls, and more. You can even add conditions to breakpoints, or make them trigger debugger commands automatically.
For example, you can set a symbolic breakpoint on a method call like this in the LLDB console
(lldb) breakpoint set -n viewDidLoadUse expr to Change Variable Values
You can use the expr (short for “expression”) command to change the value of a variable while debugging
(lldb) expr myVariable = 10Leveraging watchpoints
You can set a watchpoint on a variable to pause execution whenever the variable’s value changes. This can be especially useful for debugging issues related to state changes.
You could think of this as adding setter / getter callback in lldb session instead of code.
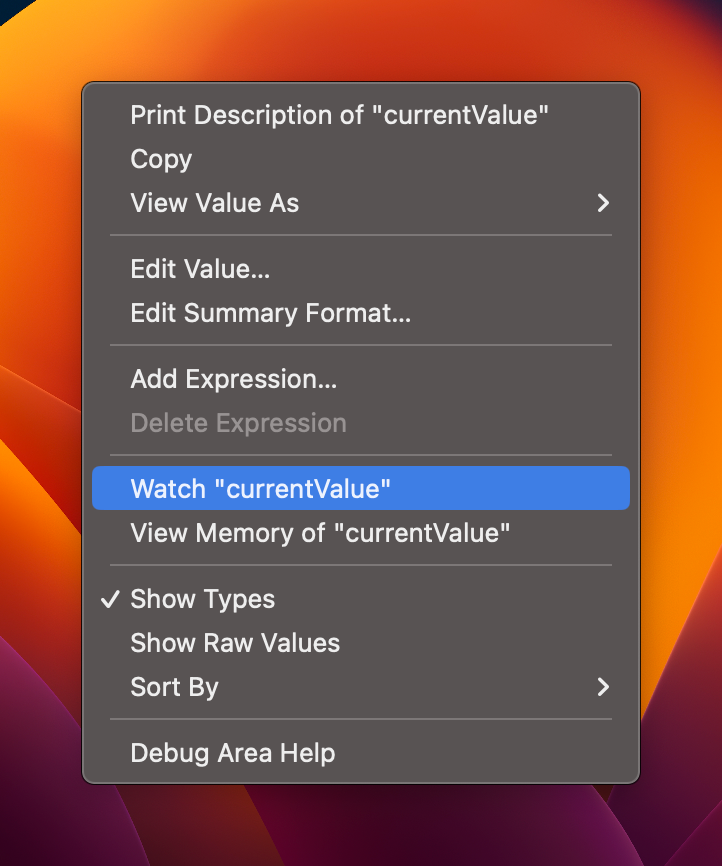
(lldb) watchpoint set variable myVariableKeep in mind if you want to access something with property wrappers you’ll need to be pretty explicit e.g. self._model.storage.object.wrappedValue._test.storage.publisher.subject.currentValue, probably easier to use Xcode visual tools:
Adding expressions to watchpoints
You can modify watchpoint to execute arbitrary code:
watchpoint command add> p variable
> DONEEntering scripting mode for watchpoints
SwiftUI
Understand why a view reloads by adding Self._printChanges() inside body of a view:
var body: some View {
  let _ = Self._printChanges()
  ... // real implementation
}
Printing SwiftUI Changes